fitroom.grid3x3_tool module
Created on Thu Aug 3 16:22:30 2017
@author: erwan
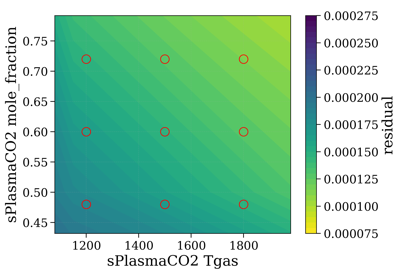
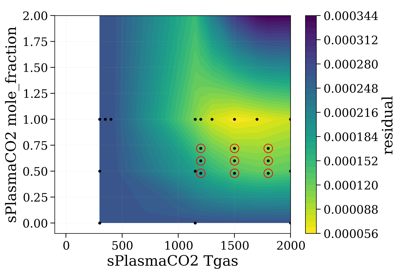
Tool to plot on 9 graphes along 2 axes (2 conditions)
- class Grid3x3(slbInteractx=None, slbInteracty=None, xparam='', yparam='', plotquantity='radiance', unit='mW/cm2/sr/nm', wunit='nm', normalizer=None, s_exp=None)[source]
Bases:
objectWhere the output of a
CaseSelectoris shown.Examples
See also
CaseSelector,MultiSlabPlot,SlabsConfigSolver,Overpopulator,FitRoom,SlitTool,When,use,plot_for_export()- calc_case(i, j, **slabsconfig)[source]
notice j, i and not i, j i is y, j is x? or the other way round. It’s always complicated with indexes anyway… (y goes up but j goes down) you see what i mean it works, anyway
- plot_case(i, j, ax_out=None, plot_all_labels=False, **slabsconfig)[source]
notice j, i and not i, j i is y, j is x? or the other way round. It’s always complicated with indexes anyway… (y goes up but j goes down) you see what i mean it works, anyway
- Other Parameters
ax_out (ax) – if None, plot to the GridTool. Else, plot to this ax (used for export)
plot_all_labels (bool) – force plot all labels
- plot_for_export(style='origin', cases=[], ls='-', lw=1, xlim=None, ylim=None, labelvar='xy', color=None, labelunit='K', cutwings=0, kwargs_exp={})[source]
Sum all center column in one case.
- Parameters
cases (list) – list of [(row, column)] to plot. If
Noneor [], use a vertical line, i.e.cases=[(1,1), (0,1), (2,1)]
ls (str (‘-’, ‘-.’, etc.), list, or dict) – if str, use the same. If list, rotate. If dict, use
casesas keys.the first one is plot in solid line, the others in alternate with ‘-.’, ‘:’, ‘-.’
- Other Parameters
labelvar (‘x’, ‘y’, ‘xy’) – which variable to add. default ‘xy’ Ex:
Tvib=, Trot=
Tvib=
Trot=
cutwings – see
plot_stack()kwargs_exp (dict) – parameters forwarded to
plot_stackto plot the experiment